
Metrics are a set of numbers: measurements that give us information about a process or an activity.
Like the height of a building is a metric that tells us how tall a building is. Or the headcount of an organization tells us how large an organization is. Or the number of likes on a video tells us how popular a video is.
Metrics help organizations gain transparency, enable decision-making and plan improvements.
In the software parlance, metrics have been in use since the 1960s. And they have continuously changed and evolved over the last 60 years to keep up with the changing needs of the industry.
Why do we need metrics?
Metrics are a way for us to “see”. We may already have qualitative ways of seeing and assessing processes and activities. However, metrics complement this qualitative knowledge with quantitative knowledge.
With this augmented knowledge of qualitative and quantitative information, teams and organizations can make better decisions, drive improvement and forecast with some degree of confidence.
Metrics also help us see trends and patterns which may be difficult to observe, in the absence of metrics.
They play an additional role of bringing objectivity to challenge some of our conscious and unconscious biases.
Since metrics are hard numbers, it’s easy to use metrics to rally people around to a common mission and start conversations to dig deeper. So, from that perspective, metrics are great investigative and communication tools: an essential tool in a change management toolkit.
There are a few things to watch out for as we identify and start using metrics.
While metrics can be a great input tool to generate insights, they make very poor targets. Goodhart’s law speaks to this.
“When a measure becomes a target, it ceases to be a good measure”.
Metrics need to be chosen wisely in line with what we’re driving for.
“What gets measured gets managed – even when it’s pointless to measure and manage it, and even if it harms the purpose of the organization to do so” (~Simon Caulkin, summarizing V. F. Ridgway’s argument in “Dysfunctional Consequences of Performance Measurements”).
Also, too many metrics can create confusion instead of promoting clarity.
Metrics are a tool and like any tool, they are only as good as who wields it. When they are weaponized to be used against people, they stop being effective and can be detrimental.
At the end of the day, metrics are just numbers and don’t tell the whole story. They are great conversation starters and that’s the best way to use them. They provide useful indicators of where we need to look deeper.
And we would caution against making the definition, collection, analysis, reporting etc. of metrics a project unto itself. Metrics aren’t the goal; they are a means.
Why Flow based metrics
There are several ways to measure the quantitative outcomes of a process. The collection of measures that tell us how things are moving across the system and the outcomes from those systems, is known as Flow based metrics or Flow metrics.
Flow metrics help us measure the rate of delivery of value which is typically of great interest to Business. In software development, they help establish a common language between IT and Business by removing the technical terms and by making them easy to understand.
Flow metrics support data driven decision making to achieve the right value delivery to in turn achieve the desired business outcomes. Because they usually measure the attributes of a system from end to end, they serve as a great means to identify and focus on the real bottlenecks in the system. This helps us focus our optimization efforts around removing or reducing the effects of these bottlenecks on business outcomes.
Difference from Efficiency metrics
Efficiency metrics are those which measure the plan/forecast of an activity or process as compared to its eventual result. Some of these metrics are Test Case Pass ratio, Story completion ratio, Test case execution efficiency etc. These efficiency metrics are focused on success of a specific activity or process – rather than the effectiveness of the entire system.
Efficiency metrics are a great way to understand the localized result or to measure a sub process. However, such metrics may not be able to provide a qualitative measure of the overall system.
Unlike Efficiency metrics, Flow metrics take into account a larger part of the system or the entire system. They are centered around the ability of the team or process to keep things moving along and delivering value.
Which Flow based metrics
There are 4 popular Flow based metrics.
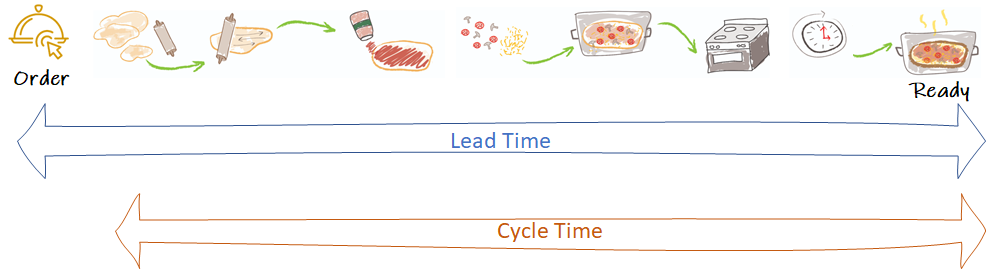
Flow time – Cycle time and Lead time
It measures the time it takes for a request or a work item to complete the journey from start to finish. While Lead time measures the overall time: from the request being created till the time the completed work product is available to the requestor, Cycle time measures the time from start of active work on the request till completion of work.
Flow Velocity or Throughput
This metric indicates the number of completed requests or work items in a given duration of time
Flow Efficiency
This helps us see how much waste or wait time we have in the system. It is a ratio of active work time to total time that a request or work item spends in the system
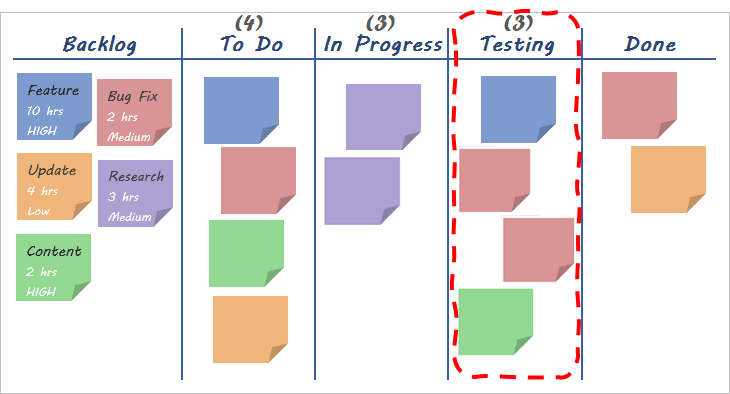
Flow Load
This is a metric that measures the work in progress (WIP) in the system or partially completed work.

Getting Started with Flow metrics
The only Flow metric not mentioned above is Flow Efficiency. The reason for that is that this can be very difficult to measure. Our wait times and waste are usually hidden inside active work. Being able to differentiate and measure the two components of work can be tricky. We may need to start with a Value Stream Mapping exercise and significantly improve the transparency and visibility in the system to be able to measure this. We may also need to rely on tools to give us these analytics. Our recommendation would be to gradually work up to this metric.
The interplay between metrics
Since flow metrics are about the system, there is a certain relationship between some of them. They might seem to be independent of each other – but some of them are very closely related and even affect each other – when one changes the other changes.
Lead time for any process is inclusive of the Cycle time. If the Cycle time increases or decreases, then the Lead time is affected too. If the Lead time of the process increases or decreases, the Cycle time may or may not be affected
If the Cycle time or Lead time of a process increases or decreases, the Throughput metric is directly affected. Increase in the Lead & Cycle time tends to reduce the Throughput when measured for a fixed unit of time.
Increase in the number of items that are in-progress can usually lead to an increase in the Lead time and reduce the Throughput (Little’s Law)
By increasing the number of items in progress, the Flow Efficiency also gets affected adversely (it reduces)
By removing the constraints (reducing the Blocked worked items), the Flow Efficiency and Throughput can be increased, and Lead time and Cycle Time can be reduced
The metrics Cycle Time and Throughput help you predict when work could be done (based on historical data). Cycle time measures the time required for work to be done. Throughput measures work done in a given amount of time. These metrics might seem to be similar, but they are not the same – if anything they are reciprocal of one another
Note: If a team measures its Velocity in terms of the number of User Stories it completes in a Sprint, then the velocity is a representation of their Throughput.
Summary
Many Agile teams that start with Scrum, tend to follow the usually recommended efficiency metrics.
As these teams continue to work and improve their processes, they may start finding these Efficiency Metrics to be limiting in their continuous improvement journey..
Such teams could be well-served by exploring Flow Metrics. Coupled with other metrics and tools such as Value Stream Maps and Kanban Boards, Flow Metrics can help them identify and eliminate waste.
Organizations ultimately aim to better their business outcomes. Flow Metrics can help us steer our systems towards these outcomes!
References:
Flow Framework: https://flowframework.org/
Goodhart’s Law: when a measure becomes a target, it cease to be a good measure. - Sketchplanations
Henrik Kniberg - One Day in Kanban Land - https://blog.crisp.se/2009/06/26/henrikkniberg/1246053060000